Figure 80: Local log list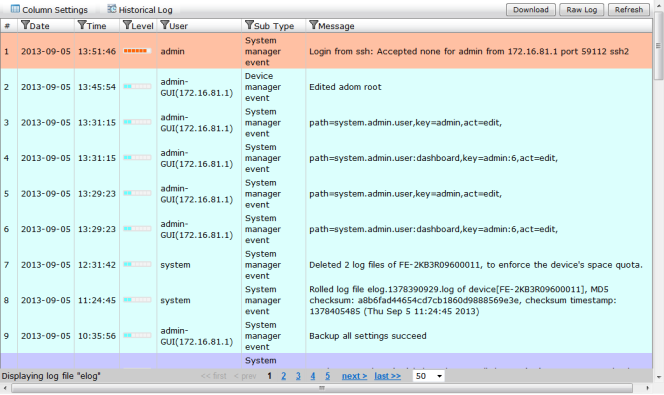
Column Settings | Select to open the column settings dialog bog. You can edit which columns are displayed and the order in which they appear. | |
Historical Log | Select to view the historical log. | |
Type | Select the type from the drop down list. Select one of the following: Event Log, FDS Upload Log, or FDS Download Log. When selecting FDS Upload Log, select the device from the drop-down list, and select Go to browse logs. When selecting FDS Download Log, select the service (FDS, FCT) from the Service drop-down list, select the event type (All Event, Push Update, Poll Update, Manual Update) from the Event drop-down list, and Go to browse logs. | |
Download | Select to download the event log elog. You can download the file as a comma separated value (CSV) file or in a normal format. Select OK to save the file to your management computer. | |
Raw Log/Formatted Table | Select to display either raw logs for a formatted table. | |
Refresh | Select to refresh the information displayed in the log table. | |
# | The log number. | |
Date | The date that the log file was generated. Select the filter icon to create a filter for this column. Select the checkbox to enable this filter and specify the from and to date in the format YYYY-MM-DD. Select Apply to apply the filter. You can also clear all filters. | |
Time | The time that the log file was generated. Select the filter icon to create a filter for this column. Select the checkbox to enable this filter and specify the from and to time in the format HH:MM:SS. Select Apply to apply the filter. You can also clear all filters. | |
Level | The log level. Select the filter icon to create a filter for this column. Select the checkbox to enable this filter. Select a value for the field from the drop-down list, select the checkbox (NOT) if required, and select the level from the drop-down list. Select Apply to apply the filter. You can also clear all filters. | |
User | User information. Select the filter icon to create a filter for this column. Select the checkbox to enable this filter. Select a value for the field from the drop-down list, select the checkbox (NOT) if required, and enter the username in the text field. Select Apply to apply the filter. You can also clear all filters. | |
Sub Type | Log sub-type information. Select the filter icon to create a filter for this column. Select the checkbox to enable this filter, then select one or more of the event types. Select Apply to apply the filter. You can also clear all filters. The available event types are: System manager event, FG-FM protocol event, Device configuration event, Deployment manager event, Real-time monitor event, Log and report manager event, Firmware manager event, FortiGuard service event, FortiClient manager event, FortiMail manager event, Debug I/O log event, Configuration change event, Device manager event, and Web service event. | |
Message | Log message details. Select the filter icon to create a filter for this column. Select the checkbox to enable this filter. Select a value for the field from the drop-down list, select the checkbox (NOT) if required, and enter a message in the text field. Select Apply to apply the filter. You can also clear all filters. | |
Page navigation | Use these page options to browse logs. You can select to display 50, 100, or 200 logs from the drop-down list. | |