Charts
The FortiAnalyzer unit provides a selection pre-defined charts. New charts can also be created, either from scratch or by cloning a previous chart.
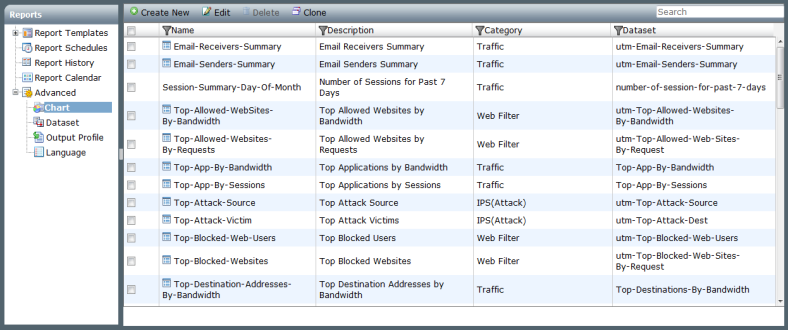
To view and configure charts, go to the Reports tab and select Advanced > Charts in the tree menu.
For a list of the currently available pre-defined charts, see
“Charts”.
To create a new chart:
1. Go to the Reports tab and select Advanced > Chart in the tree menu.
2. Select Create New on the tool bar, or right-click in the chart list and select New from the pop-up menu.
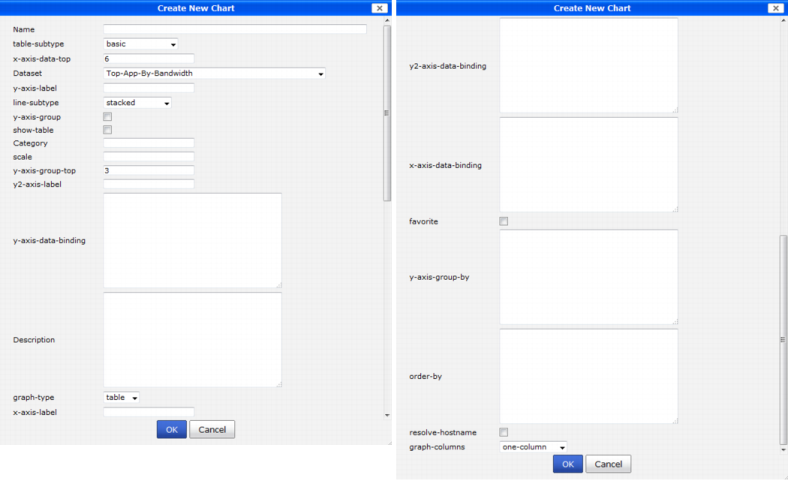
The Create New Chart dialog box opens.
3. Enter the required information for the new chart.
Name | Enter a name for the chart. |
table-subtype | Select a table subtype from the drop-down list. The available types are: basic, composite-bar, composite-line, basic-with-pie, and bar-with-pie. |
x-axis-data-top | Enter the maximum value for data on the x-axis. |
Dataset | Select a dataset from the drop-down list. See “Datasets” for more information. |
y-axis-label | Enter a label for the y-axis. |
line-subtype | Select the line subtype from the drop-down list. The options are: basic, stacked, and back-to-back. |
y-axis-group | Select to enable the y-axis-group. |
show-table | Select to show the table. |
Category | Enter a category for the chart. |
scale | Enter a scale for the chart. |
y-axis-group-top | Enter the top value for the y-axis group. |
y2-label-axis | Enter a label for the second y-axis. |
y-axis-data-binding | Enter the y-axis data binding information. |
Description | Enter a description. |
graph-type | Select a graph type from the drop-down list. The options are: table, bar, pie, and line. |
x-axis-label | Enter a label for the x-axis. |
y2-axis-data-binding | Enter the data binding information for the second y-axis. |
x-axis-data-binding | Enter the data binding information for the x-axis. |
favorite | Select to set the chart as a favorite. |
y-axis-group-by | Enter what the y-axis is to be grouped by. |
order-by | Enter ordering information. |
resolve-hostname | Select to resolve the hostname. |
graph-columns | Select if the graph will have one or two columns from the drop-down list. |
4. Select OK to create the new chart.
To clone a chart:
1. Go to the Reports tab and select Advanced > Chart in the tree menu.
2. Select the chart that you would like to clone and select Clone from the tool bar or right-click menu. The Clone Chart dialog box opens.
3. Edit the information as needed and select OK to clone the chart and create a new chart.
To edit a chart:
1. Go to the Reports tab and select Advanced > Chart in the tree menu.
2. Double-click on the chart that you would like to edit, or select the chart and select Edit from the tool bar or right-click menu. The Edit Chart dialog box opens.
Pre-defined charts cannot be edited, the information can only be viewed.
3. Edit the information as required and select OK to finish editing the chart.
To delete charts:
1. Go to the Reports tab and select Advanced > Chart in the tree menu.
2. Select the chart or charts that you would like to delete and select Delete from the tool bar or right-click menu.
Pre-defined charts cannot be deleted.
3. Select OK in the confirmation dialog box to delete the chart or charts.