Figure 89: Log view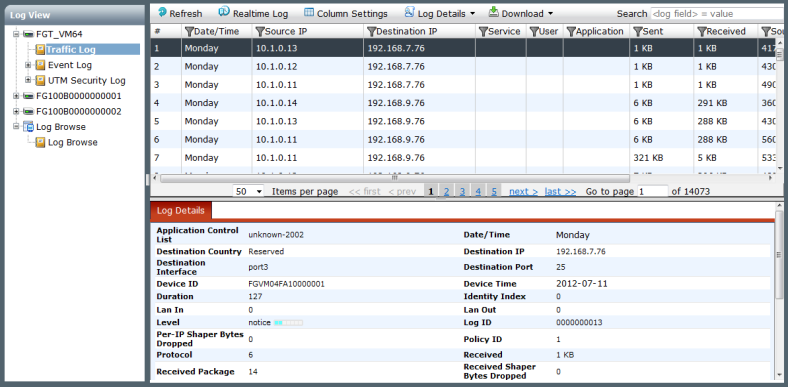
Refresh | Refresh the log view. |
Realtime Log | Select to change to the real time view, where the log table is updated in real time. |
Historical Log | Select to change to the historical log view, where logs are not updated in real time, and can be downloaded and searched. This option is only available when in the real time view. |
Column Settings | Select to change the columns to view and the order they appear on the page. |
Log Details | Adjust the location and visibility of the Log Details frame. It can be hidden, or visible on the bottom or right side of the content pane. For more information, see “Log details”. |
Download | Select to download the logs. Two options are available: • Current View: Select to download log files in text (.txt), or comma-separated value (.csv). The downloaded version will match the current log view, containing only log messages that match your current filter settings. • Raw Log: Select to download log files in text (.txt), or comma-separated value (.csv) for a specified date and time range. |
Search | Search the logs based on the search terms entered in the search field. |
Date/Time | The date and time the log was received by the FortiAnalyzer unit. |
Other | Other columns will be available, depending on the log type selected in the tree menu. |
Pages | Settings to adjust the number of logs listed per page and to browse through the pages of logs. |
Log Details frame | Detailed information on the log message selected in the log message list. See “Log details” for more information. |